
Every fixed-price offer, every portfolio valuation and every transfer price between trading and sales starts from the same data: the forward curve. Here is what a PFC is, how it is built and which mistakes to avoid when using it.
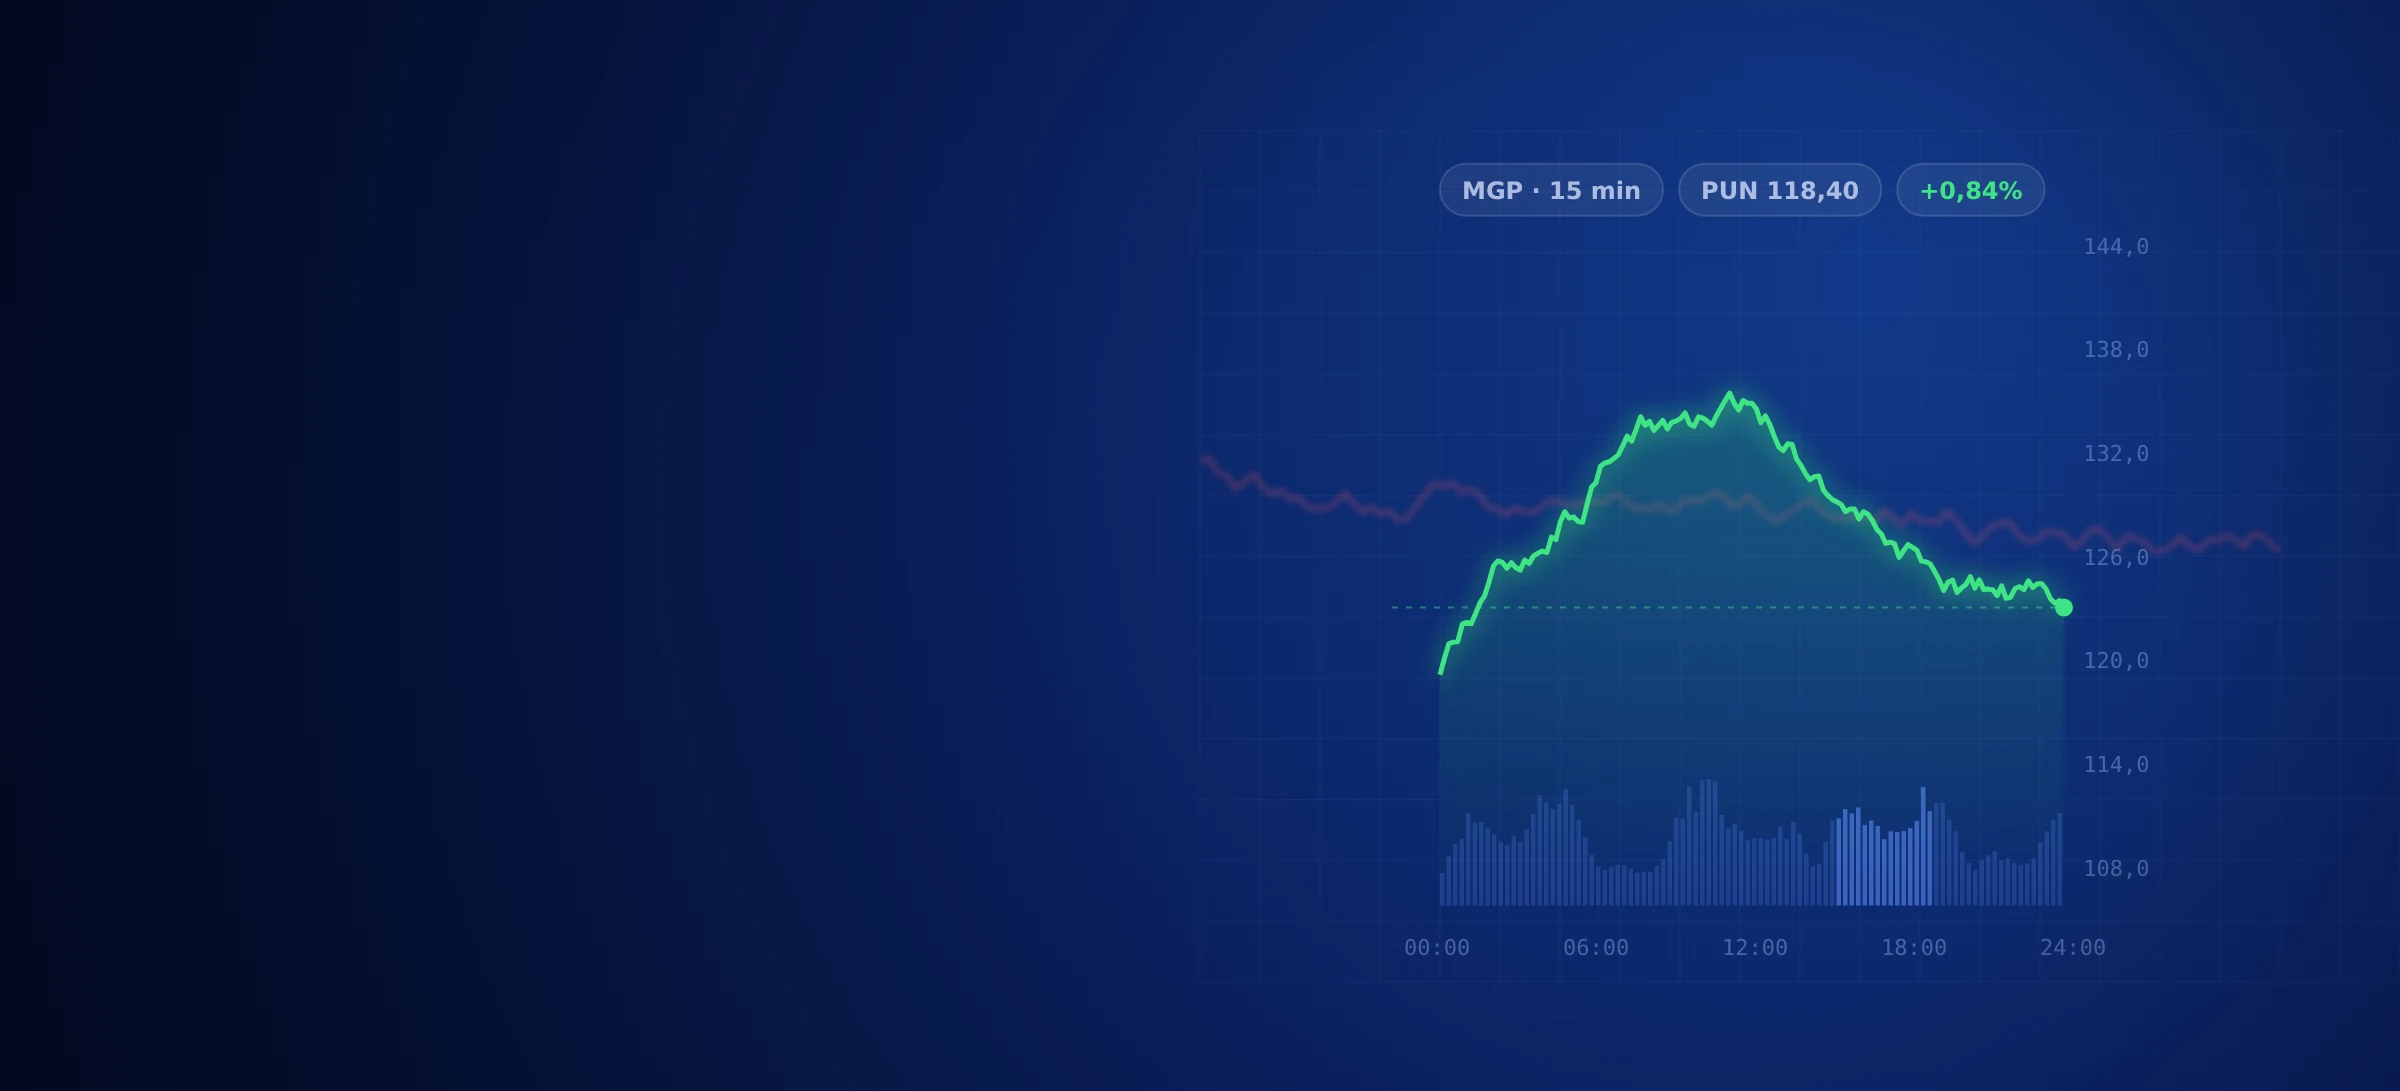
The forward curve, or price forward curve (PFC), is the series of electricity or gas prices for each future period, built from the quotes of forward products traded on the market. It is the price at which the market values today the energy that will be delivered tomorrow, next month or in two years' time, and it is the common basis for pricing offers, valuing the portfolio and setting the transfer price between trading and sales.
Why a forward curve is needed
The forward market quotes a few standard products: a month, a quarter or a year, baseload or peak. Customers, however, do not consume in blocks: each supply point has its own profile, different between day and night, weekdays and holidays, summer and winter. To know how much it costs to cover that profile, you need a price for each hour, or each quarter-hour, consistent with what the market quotes.
This is exactly the problem the PFC solves: it turns a set of aggregate quotes into a detailed curve on which any consumption or generation profile can be valued.
How a PFC is built
Methods vary from operator to operator, but the basic steps are the same.
Collecting quotes. The starting point is end-of-day prices for forward products traded on exchanges or over the counter, plus the latest spot prices, collected from exchanges, brokers and data providers.
Consistency between products. Quotes overlap: a year contains four quarters, a quarter three months. The curve must respect all of them at once, leaving no room for arbitrage between products.
Shaping. Monthly prices are spread over individual hours or quarter-hours using profiles derived from market history: seasonality, differences between weekdays and holidays, peak and off-peak hours. The rule is that the curve's averages stay equal to the original quotes.
Market specifics. In Italian power, the differences between market zones and the PUN Index GME as a reference matter; in gas, the reference is the PSV. For distant periods, where the market is illiquid, explicit and documented assumptions are needed.
Historical storage. Every curve generated must be stored with its date. Only then, months later, is it possible to reconstruct which curve a price or a valuation was calculated on.
How the forward curve is used
- Pricing offers. The customer's consumption profile, broken down by hour, is valued on the PFC: the result is the procurement cost, to which premiums for profile and volume risk and the mark-ups of the various parties are added.
- Setting the transfer price. The same curve defines the price at which trading makes energy available to sales, so that each function is accountable for its own results.
- Valuing the portfolio. Mark-to-market revalues contracts and hedges every day on the latest curve and measures how much the open position is worth.
- Tracking prices for customers. In indexed contracts with fixing, the curve shows the customer and the sales network when the market reaches the expected price.
The most common mistakes
Mistaking it for a forecast. The PFC does not say what the spot price will be, but how much it costs to hedge today. Those who use it as a forecast risk taking positions without realising it.
Using an old curve. In volatile periods, a price calculated on a curve a few days old can be out of market. Offers must have a validity consistent with how often the curve is updated.
Different curves in different departments. If sales prices on one curve and trading values on another, margins never add up. A single curve, distributed to every system, avoids endless month-end discussions.
Ignoring granularity. Under TIDE the Italian power market works in 15-minute periods: for customers with highly variable profiles, an hourly-only curve may no longer be enough.
How MAS does it: ERGO and QUE MAS
In ERGO Portfolio, the MAS ETRM, quotes and spot prices arrive automatically from exchanges and data providers, and the end-of-day PFC is generated every day and stored historically; curves can be edited or loaded from Excel, with versioning. The same curve feeds mark-to-market, what-if analysis and risk.
On the sales side, QUE MAS Corporate, the CPQ for business customers, calculates offer prices on always up-to-date power and gas PFCs, breaks the consumption profile down by hour and applies each party's mark-up; curves can also come from an external provider. PRICE ALERT tracks price curves and alerts the sales network, ERMES passes customers' fixings to trading and QUE MAS Portfolio compares sale prices, costs and market.
To see how the curve fits into the offer cycle, read the guide to CPQ for power and gas, or request a demo.
Frequently asked questions
What is an energy forward curve?
The price forward curve (PFC) is the curve of electricity or gas prices for each future period, down to the hour or quarter-hour, built from the quotes of forward products traded on the market. It is the price at which the market values future energy deliveries today.
Is the PFC a forecast of the spot price?
No. The PFC expresses today's value of future energy according to the forward market, i.e. the price at which one can hedge today. The actual spot price may turn out differently: that is why the PFC is updated every day with new quotes.
How is an hourly PFC built?
Quotes for standard products, such as baseload and peak months, quarters and years, are collected and made consistent with each other, then spread over individual hours or quarter-hours using seasonality, holiday and time-band profiles, keeping the averages equal to the market quotes.
What is the PFC used for in power and gas sales?
It is used to calculate the procurement cost of an offer: the customer's consumption profile is valued on the PFC, and risk premiums and mark-ups are added to the result. The same curve is used to mark the portfolio to market and to set the transfer price between trading and sales.
How often should the forward curve be updated?
Usually every day, with end-of-day quotes. A price calculated on an old curve can be out of market the very next day; this is also why curves should be stored historically, so that every price and every valuation can be reconstructed.
Talk to us
Want to see QUE MAS at work on your data?
A demo with the people who develop the product, on a case similar to yours. No commitment.